Bonus Material: Free Content Performance Tracking Guide
How do you know if your content marketing is “working”?
The trick: set a goal BEFORE you create your content. Then track it, like this:
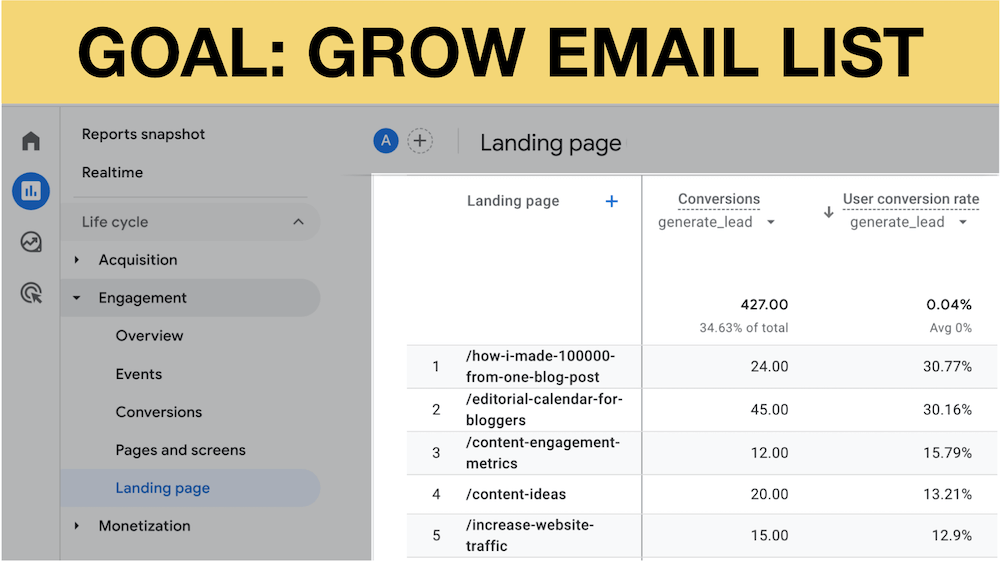
Do you want more website traffic? A bigger email list? Higher Google rankings?
Grab my content performance tracking guide below to see how I track my #1 goal.
Then look through my list of content engagement metrics below to track ROI against your goal.
1. Users
Increase Website Traffic
What Are Users?
Users are the number of (unique) visitors to a post or page on your website.
Why Are Users Important?
You want your content to be reaching new people who have never heard of you before.
Growing users is how you grow your audience, brand awareness, and multiply your content’s engagement.
Where To Track Users
In Google Analytics 4 go to Life cycle > Engagement > Pages and screens.
Look at the Page path and screen class and Users columns.
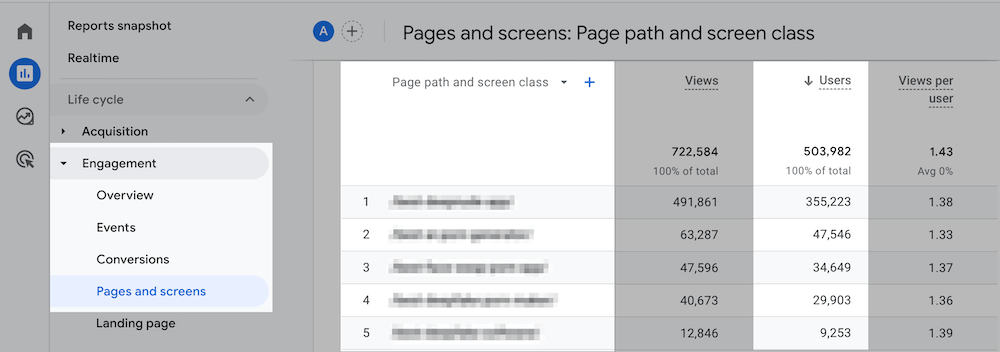
Note: In Universal Analytics this report was under Behavior > Site Content > All Pages.
How To Optimize For Users
- Check if your users are consistently increasing month-over-month like you expect (set your Date Range to “Last 30 days”, check the Compare to: Previous period checkbox, and hit Apply.)
- If they are, keep doing what you’re doing.
- If not, follow my step-by-step process to fill a content calendar that consistently drives new, unique visitors to your site long term.
2. Source/Medium
Increase Website Traffic
What Is Source/Medium?
Source/Medium is the marketing channels that assisted with the consumption of your content.
Why Is Source/Medium Important?
You can quickly see at a glance what marketing channels (organic, email, referral, social) drive the most traffic to your content, then double down on growing those channels.
Where To Track Source/Medium
In Google Analytics 4 go to Life cycle > Acquisition > Traffic acquisition.
Look at the Session source / medium and Users columns.
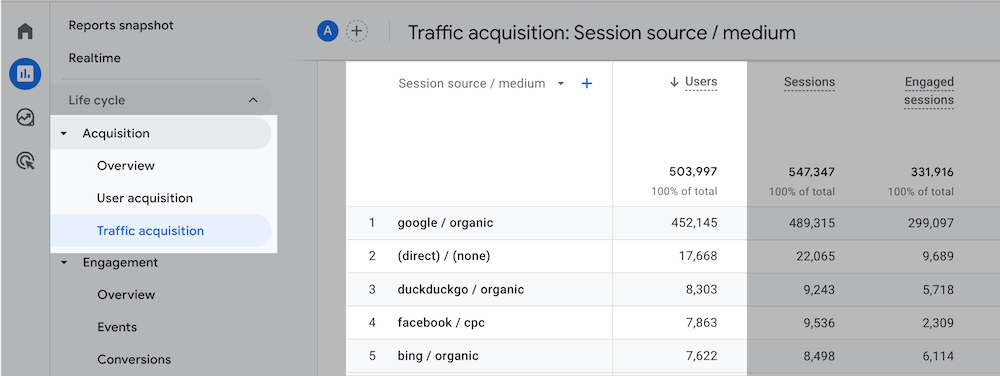
Note: In Universal Analytics this report was under Acquisition > All Traffic > Source/Medium.
How To Optimize For Source/Medium
- Identify your highest traffic channel.
- If it’s organic, follow my organic traffic strategy. If it’s email, follow my email list growth strategy.
- If it’s social, research the most popular Facebook/Twitter/Pinterest content in your industry on BuzzSumo, then create similar content with your own unique take. If it’s referral, find new ways to get more traffic from that site.
3. Country
Increase Website Traffic
What Is Country?
Country is the countries where your website traffic comes from.
Why Is Country Important?
Knowing which country most of your visitors come from can help inform what content you write.
You can look at what topics people search for most in that country, and prioritize writing content on those topics.
Where To Track Country
In Google Analytics 4 go to User > Demographics > Demographic details.
Look at the Country and Users columns.
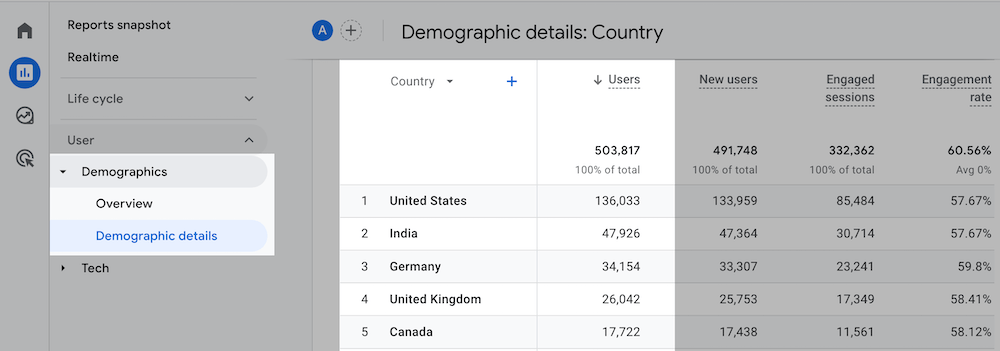
Note: In Universal Analytics this report was under Audience > Geo > Location.
How To Optimize For Country
- Identify your top traffic country.
- Prioritize writing topics with more traffic potential in your top traffic country. (e.g. if you want to double down on increasing Malaysian website traffic, only look at the traffic potential of the top ranked post for your topic on the Google Malaysia search engine.)
- Reach out to well-known influencers in your top traffic country to contribute to your blog.
4. Mobile
Increase Website Traffic
What Is Mobile?
Mobile is the number of people consuming your content on a mobile device.
Why Is Mobile Important?
If a significant percentage of new users (>50%) are coming to your site from mobile, it’s a sign lots of new visitors are finding your content from mobile search.
Where To Track Mobile
In Google Analytics 4 go to User > Tech > Tech details.
Look at the Device category and Users columns.
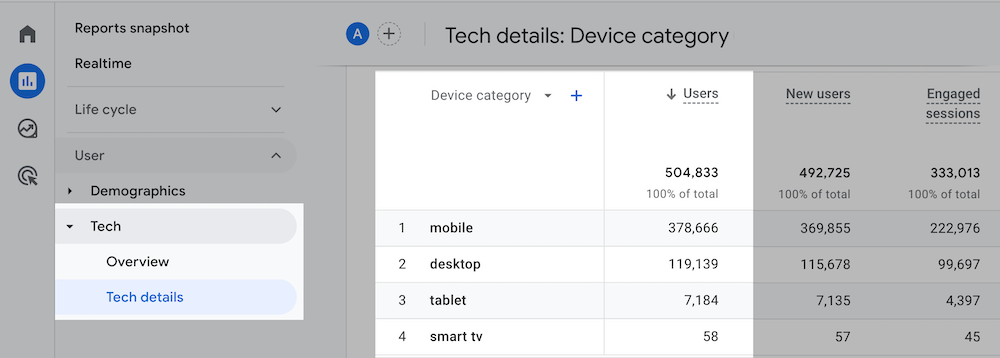
Note: In Universal Analytics this report was under Audience > Mobile > Overview.
How To Optimize For Mobile
- Check to see if >50% of your new users are coming from mobile.
- If they are, get a developer to help optimize your mobile speed score to >90 based on Google PageSpeed Insights analysis of your site.
- Focus on incorporating content formats that are easy to view on mobile, such as infographics, and video. And use shorter, sharper sentences, and more images to break up your text.
5. Conversions
Grow An Email List
What Are Conversions?
Conversions are events you set up inside Google Analytics 4 to track newsletter signups, pdf downloads, contact form completions, etc.
Why Are Conversions Important?
If your content is super engaging, people will want to be notified when you publish something new, download your premium gated content, and contact you for help.
Where To Track Conversions
In Google Analytics 4 go to Life cycle > Engagement > Landing page.
In the far right Conversions column select your Event.
Look at the Landing page and Conversions columns.
If you can't see the "Conversions" column, on the top right corner of the report click on Customize report (pencil icon) > Metrics > Add metric > Conversions.
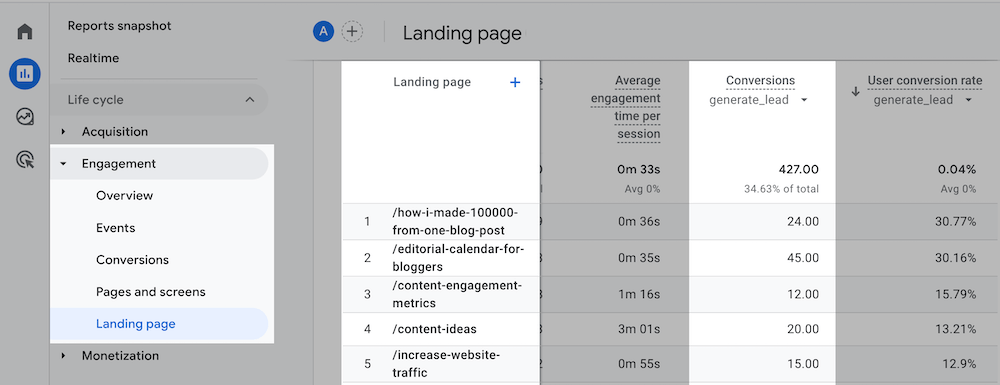
Note: In Universal Analytics this report was under Behavior > Site Content > Landing Pages.
Important: You will only see this data after you add a Google Analytics 4 Event for email sign ups.
To see how to set it up, grab a free copy of my step-by-step content performance tracking guide below.
How To Optimize For Conversions
- Check if your conversions for email signups are consistently increasing month-over-month like you expect (set your Date Range to “Last 30 days”, check the Compare to: Previous period checkbox, and hit Apply.)
- If they are, keep doing what you’re doing.
- If not, follow my step-by-step email list growth strategy to get more email signups.
6. User Conversion Rate
Grow An Email List
What Is User Conversion Rate?
User conversion rate is the total number of event completions, divided by the total number of users on your website.
Why Is User Conversion Rate Important?
If people are joining your email list, downloading your gated content, contacting you, installing your software, etc it’s safe to say they find your content engaging.
Where To Track User Conversion Rate
In Google Analytics 4 go to Life cycle > Engagement > Landing page.
In the far right User conversion rate column select your Event.
Look at the Landing page and User conversion rate columns.
If you can't see the "User conversion rate" column, on the top right corner of the report click on Customize report (pencil icon) > Metrics > Add metric > User conversion rate.
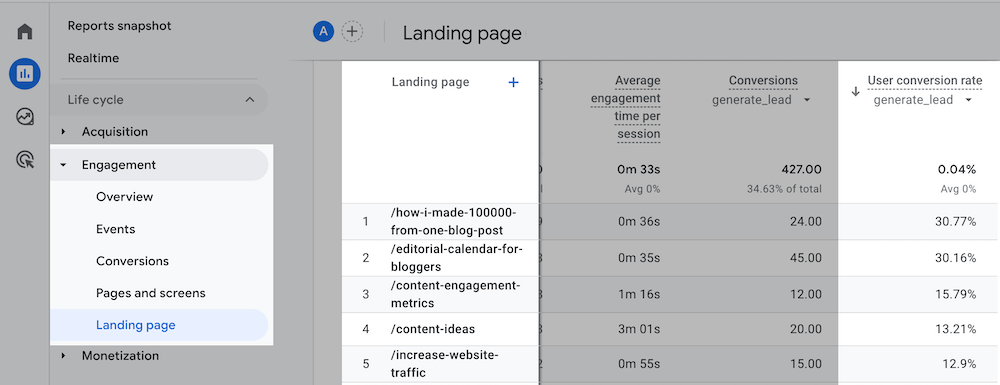
Note: In Universal Analytics this report was under Behavior > Site Content > Landing Pages.
Important: You will only see this data after you add a Google Analytics 4 Event for email sign ups.
To see how to set it up, grab a free copy of my step-by-step content performance tracking guide below.
How To Optimize For User Conversion Rate
- Check if your user conversion rate for email sign ups are consistently increasing month-over-month like you expect (set your Date Range to “Last 30 days”, check the Compare to: Previous period checkbox, and hit Apply.)
- If they are, keep doing what you’re doing.
- If not, use the step-by-step email list growth strategy I used to increase email leads from 3k to 10k per month in 5 months.
7. Purchases
Generate Sales
What Are Purchases?
Purchases are the number of sales that come from online transactions on your blog.
Why Are Purchases Important?
You can see if your content marketing efforts are leading to paid transactions.
Where To Track Purchases
In Google Analytics 4 go to Life cycle > Engagement > Conversions.
Look at the Event name and Conversions columns.

Note: In Universal Analytics this report was under Conversions > Ecommerce > Overview.
Important: You will only see this data after you add a Google Analytics 4 Event for purchases.
To see how to set it up, grab a free copy of my step-by-step content performance tracking guide below.
How To Optimize For Purchases
- Check if your purchases are consistently increasing month-over-month like you expect (set your Date Range to “Last 30 days”, check the Compare to: Previous period checkbox, and hit Apply.)
- If they are, keep doing what you’re doing.
- If not, follow the ski slope strategy (my step-by-step content strategy that drove 1,070 recurring revenue customers in 12 months).
8. Average Engagement Time
Higher Google Rankings
What Is Average Engagement Time?
Average engagement time is the average time spent on one blog post or page.
It doesn’t take into account time on page for visitors who bounce within 10 seconds, or time people spend on the last page before leaving your site (as it’s triggered by a click to the next page).
Why Is Average Engagement Time Important?
You can see how long your content is holding people’s attention.
Where To Track Average Engagement Time
In Google Analytics 4 go to Life cycle > Engagement > Pages and screens.
Look at the Page path and screen class and Average engagement time columns.
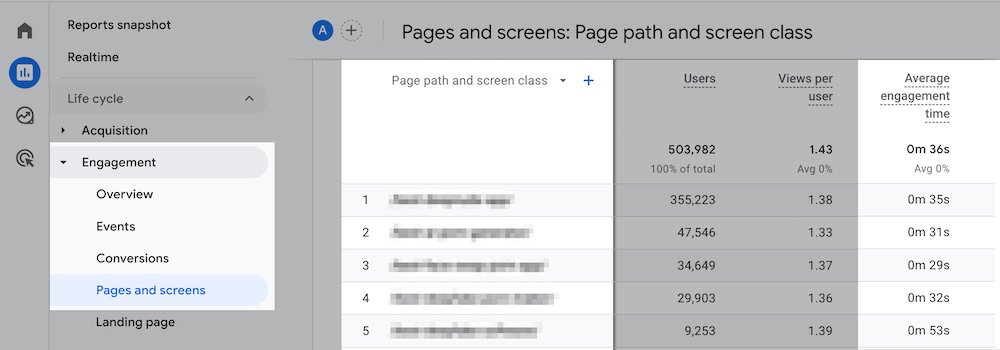
Note: In Universal Analytics this report was under Behavior > Site Content > All Pages.
How To Optimize For Average Engagement Time
- Identify the top three posts on your site that have the highest average engagement time.
- See what content elements they have in common (layout, images, videos, etc)
- Apply those elements to your other content.
9. Views Per User
Higher Google Rankings
What Are Views Per User?
Views per user are the total number of pages someone visits while browsing your website.
Why Are Views Per User Important?
You can see how much people love your content, by how many pages they view.
In isolation however, views per user are misleading. For example, if you see a combination of high views per user, low average engagement time, and low bounce rate – this can be a strong indicator people can’t find the content they came to your site for.
Where To Track Views Per User
In Google Analytics 4 go to Life cycle > Engagement > Pages and screens.
Look at the Page path and screen class and Views per user columns.
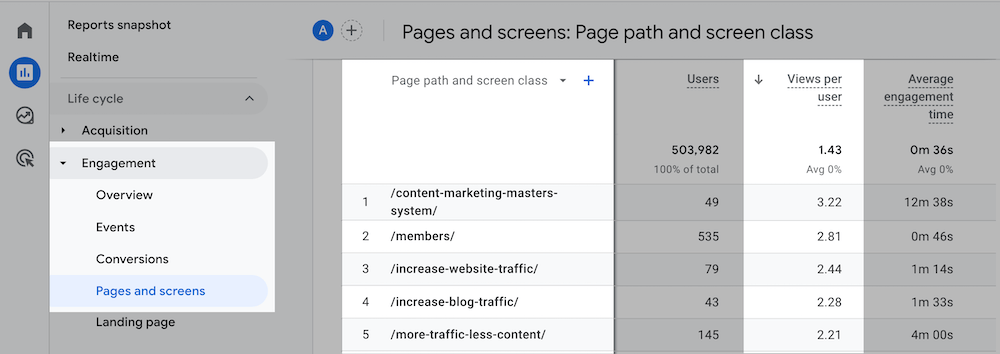
Note: In Universal Analytics this report was under Behavior > Site Content > All Pages.
How To Optimize For Views Per User
- Make sure your content matches what you promise in your headline.
- Inside every blog post internally link to other relevant, high traffic content you know readers of that topic are interested in.
- Link to a “next step” article at the end of your post to serialize your content.
10. New vs Returning
Higher Google Rankings
What Is New vs Returning?
New vs returning is the number of new visitors to your website vs. the number of returning visitors.
Why Is New vs Returning Important?
If your returning visitors metric is higher than new, it’s a sign you likely have a loyal tribe of followers.
If your new visitors are higher than returning, it’s a sign you have some work to do to get people to come back again.
Where To Track New vs Returning
In Google Analytics 4 go to Life cycle > Monetization > Retention.
Look at the New users vs Returning users metrics.
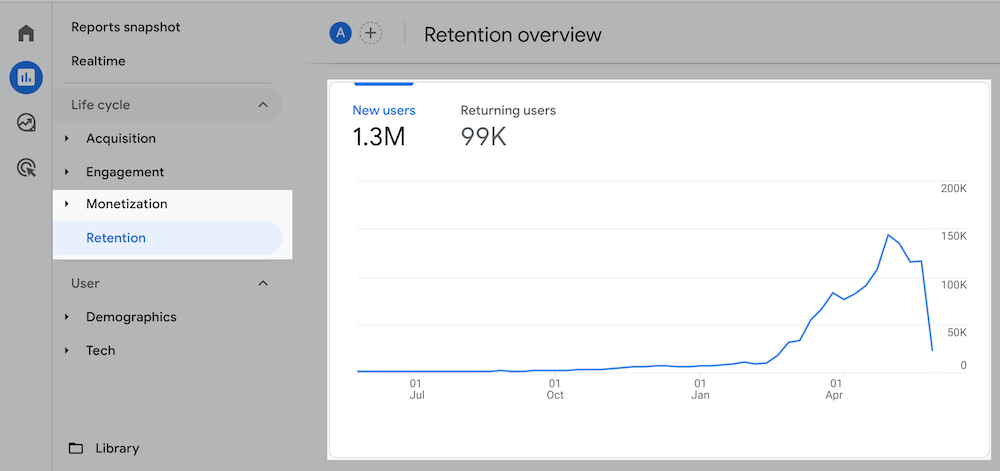
Note: In Universal Analytics this report was under Audience > Behavior > New vs Returning.
How To Optimize For New vs Returning
- Check to see if >50% of your visitors are returning.
- If they are, keep doing what you’re doing.
- If not, use my step-by-step email list growth strategy to grow your email list so you can drive more new visitors back to your site.
4 Bonus Content Engagement Metrics
Here are four bonus metrics you can't find inside Google Analytics 4, but we also think are useful to monitor.
11. Social Shares
Increase Website Traffic
What Are Social Shares?
Social shares are the number of times your content gets shared on social media.
Why Are Social Shares Important?
They’re a personal endorsement from someone you’ve never met who shares your content with their audience.
Where To Track Social Shares
In BuzzSumo go to Content Research > Content Analyzer.
Look at the Total Engagements column.
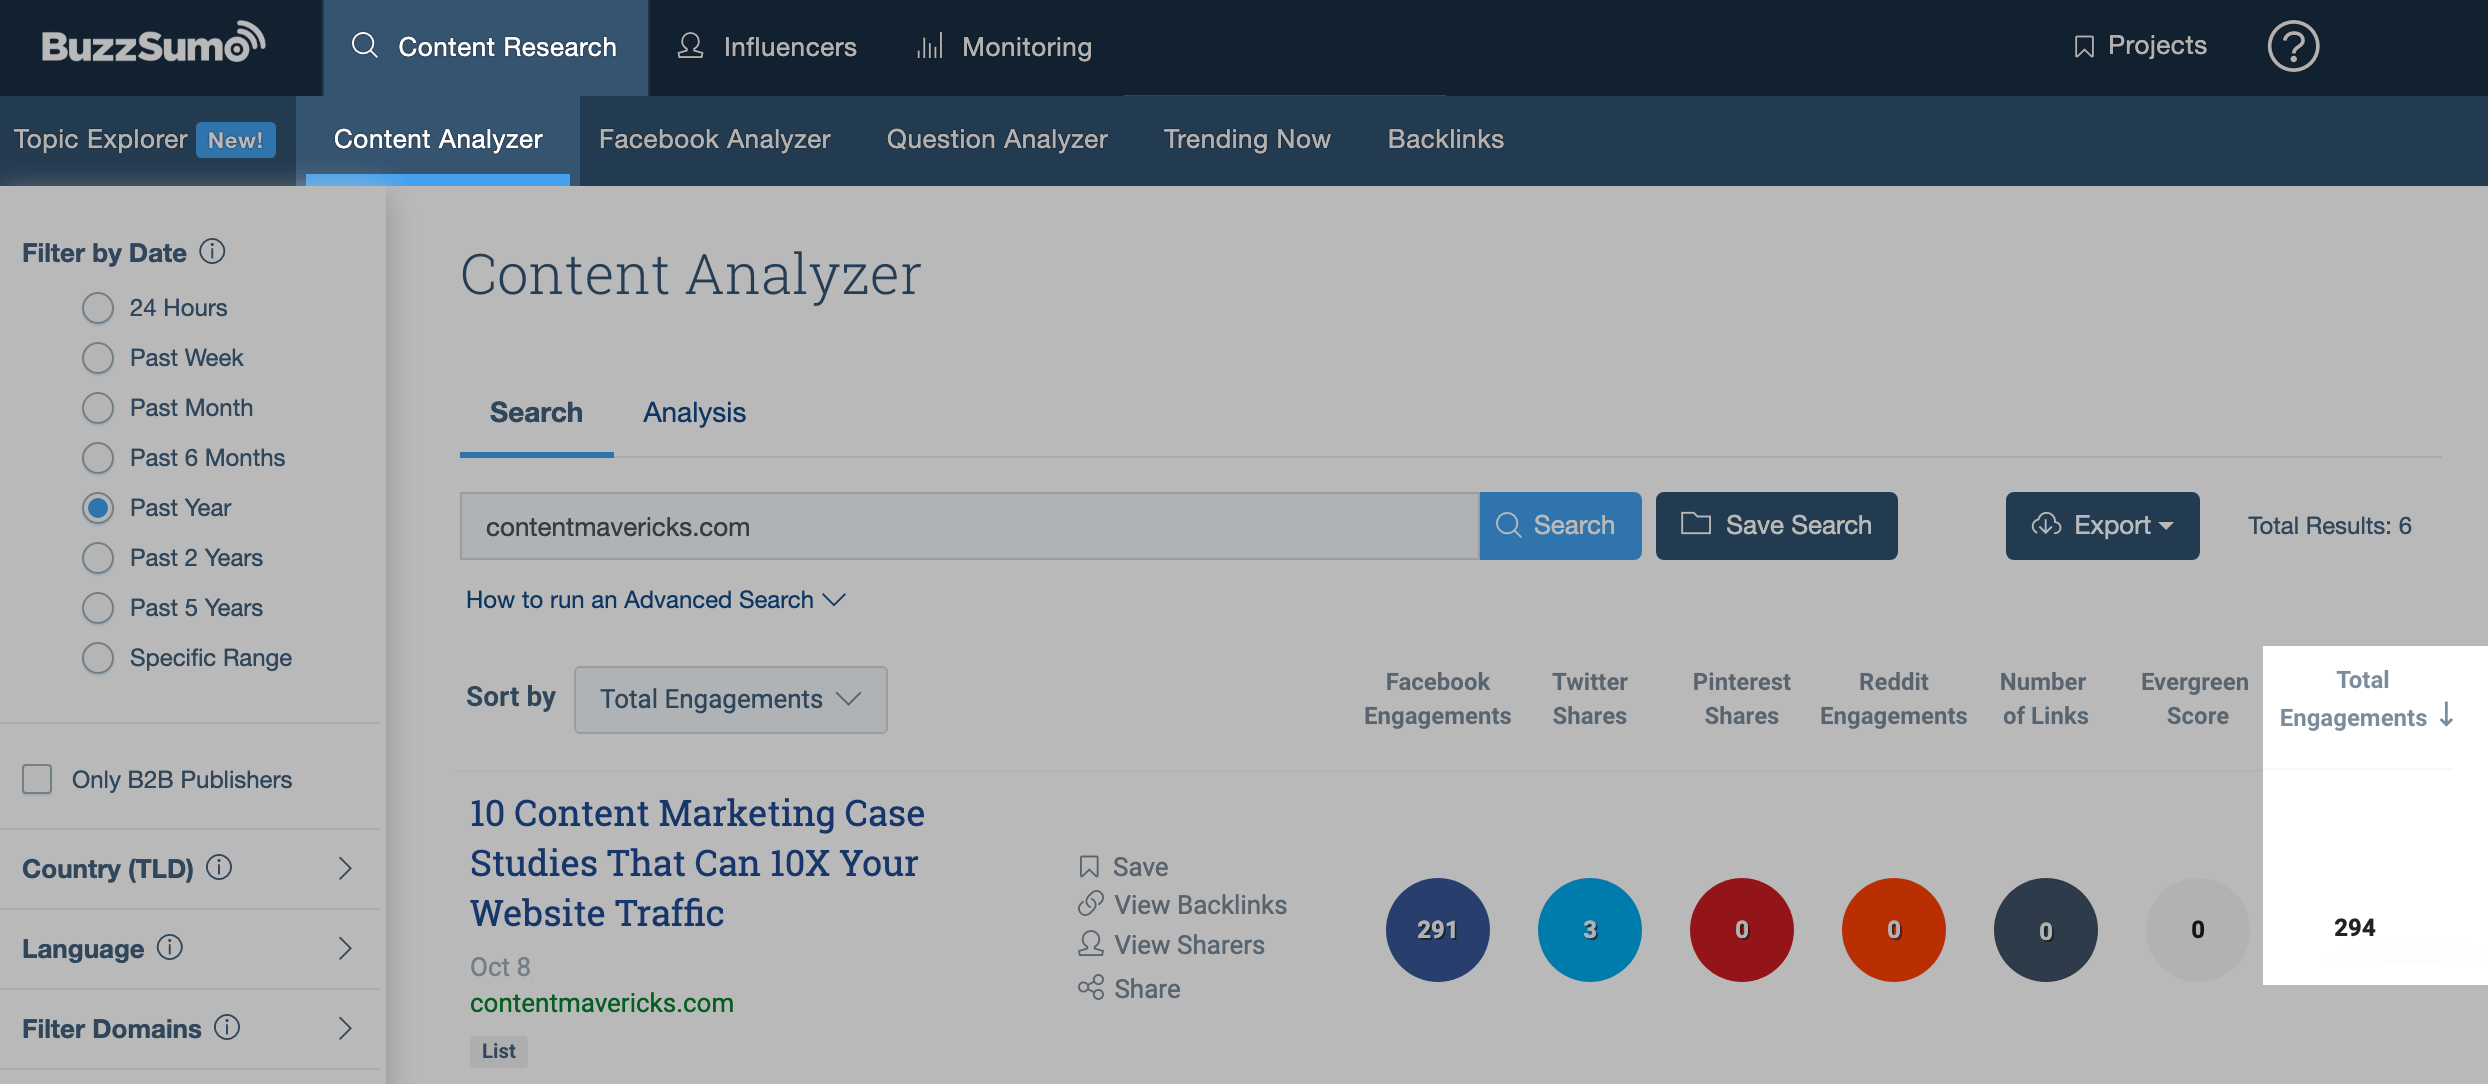
How To Optimize For Social Shares
- Make sure your content has a unique viewpoint and you back it up with data.
- Follow my step-by-step content distribution strategy for increasing the social shares and traffic you get to your content.
12. Backlinks
Higher Google Rankings
What Are Backlinks?
Backlinks are the number of external websites that link to your content.
Why Are Backlinks Important?
A handful of backlinks from high domain authority sites in your industry can help boost your own sites' domain authority.
This will make your site more competitive when it comes to ranking your content on Google.
Where To Track Backlinks
In Semrush go to Domain Analytics > Backlinks.
Enter your URL and look at the Backlinks tab.
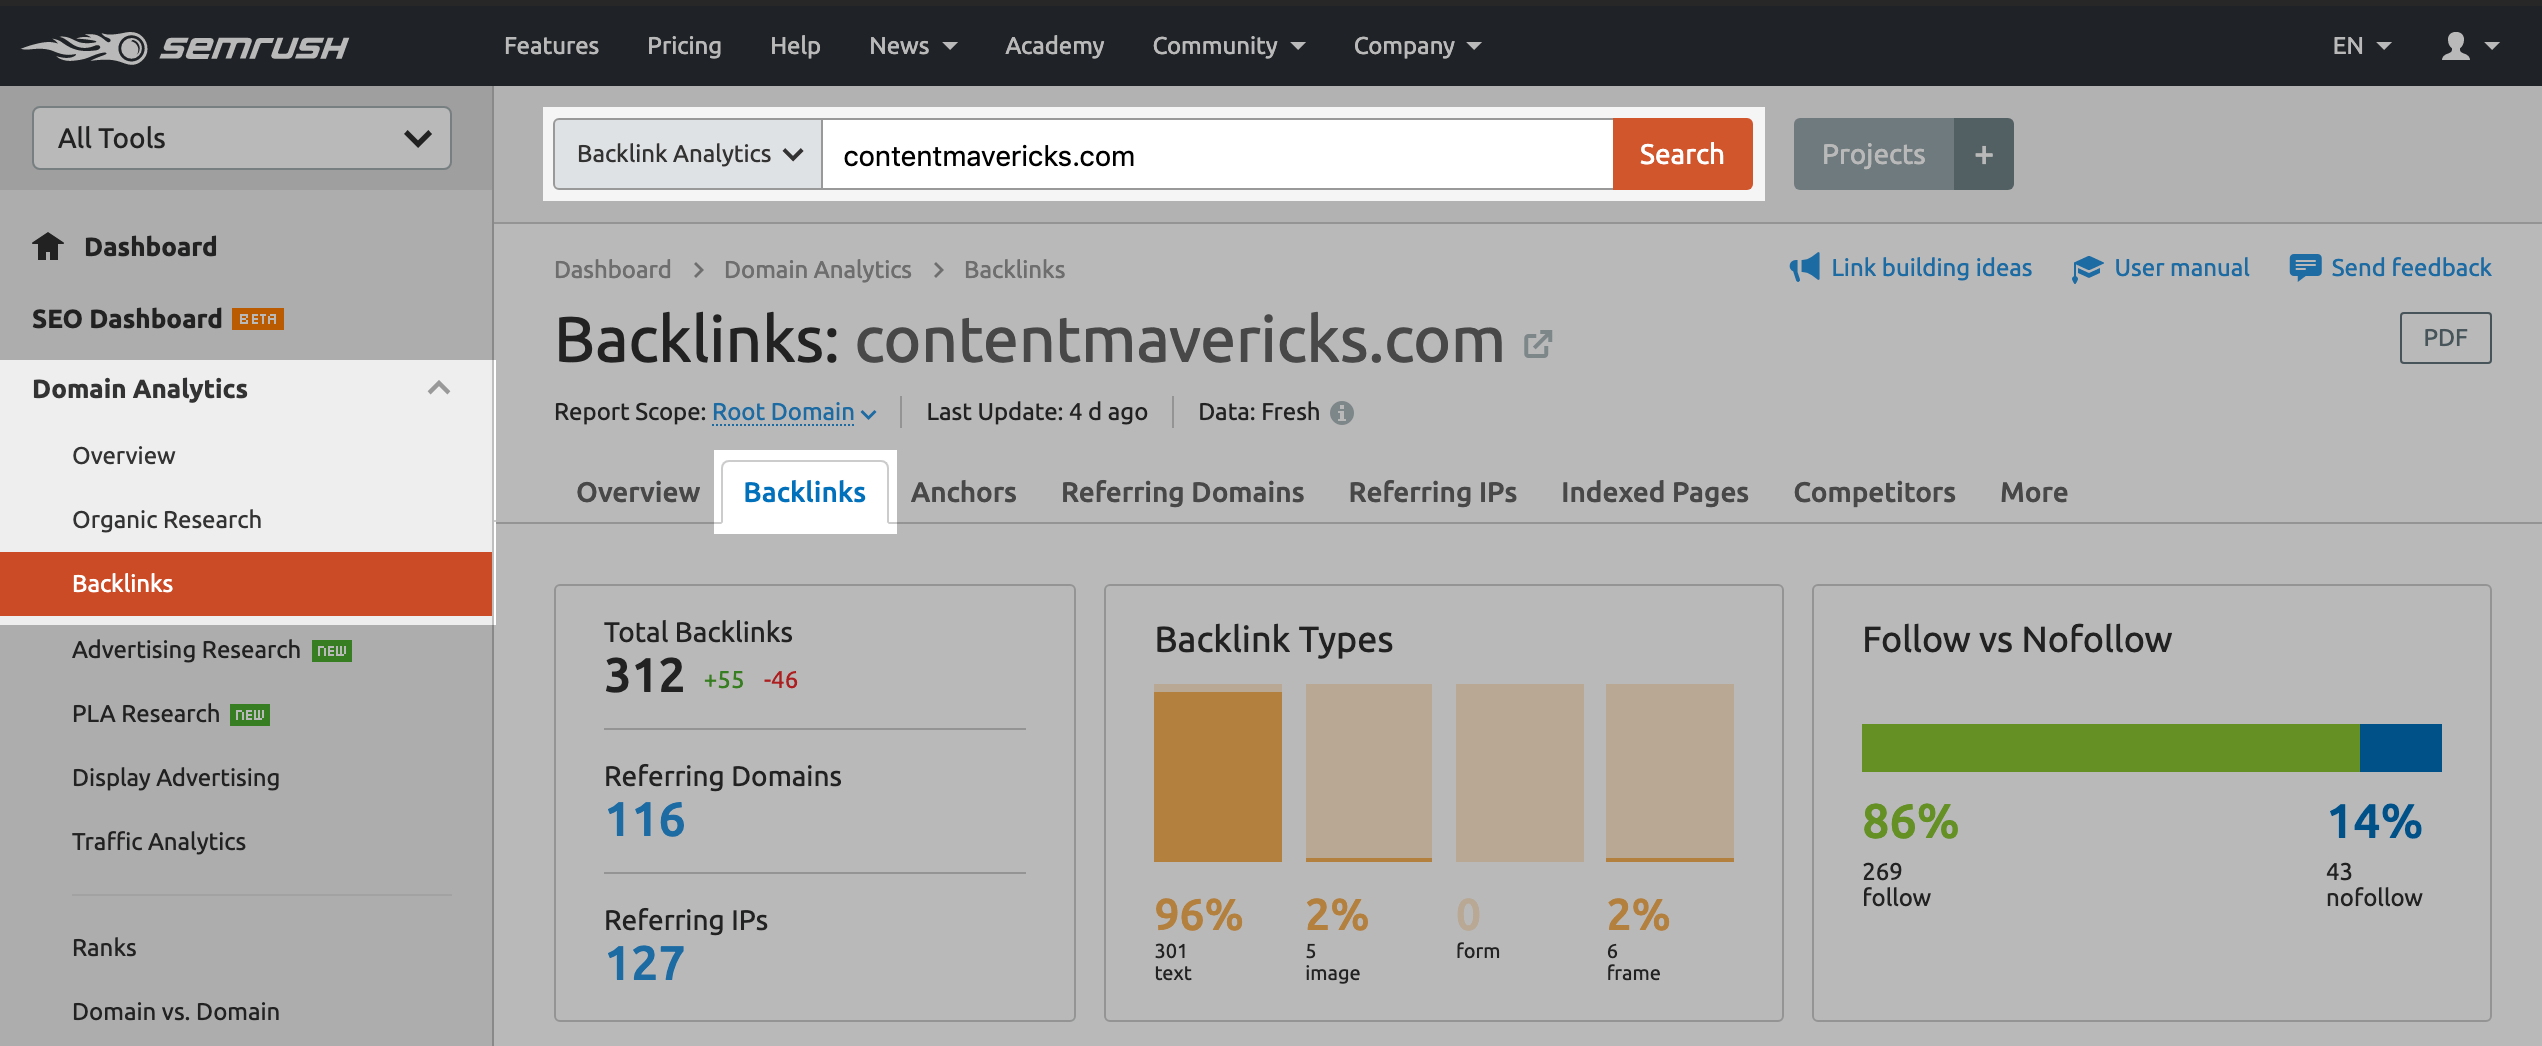
Note: Semrush is a paid tool, but they gave me a 14-day free trial for Content Mavericks readers. Perfect for tracking your increase/decrease in backlinks.
How To Optimize For Backlinks
- Sign up as a source for HARO.
- Under My Account > HARO Preferences select the category related to your business that you’d like to be a source for.
- Get the email updates they send three times a day (5:35am, 12:35pm and 5:35pm ET), Monday through Friday. Reply to relevant ones within 10 minutes that are published on a site with domain authority of 30+.
13. Brand Mentions
Increase Brand Awareness
What Are Brand Mentions?
Brand mentions are the number of new sites who mention your brand name.
Why Are Brand Mentions Important?
Brand mentions are a sign your content is making a real impact on writers and influencers in your industry.
They can lead to unsolicited media inquiries, better brand perception, and ultimately more sales.
Where To Track Brand Mentions
In Semrush go to Projects > Brand Monitoring.
Set up brand monitoring for your brand name, and look at the Mentions tab.
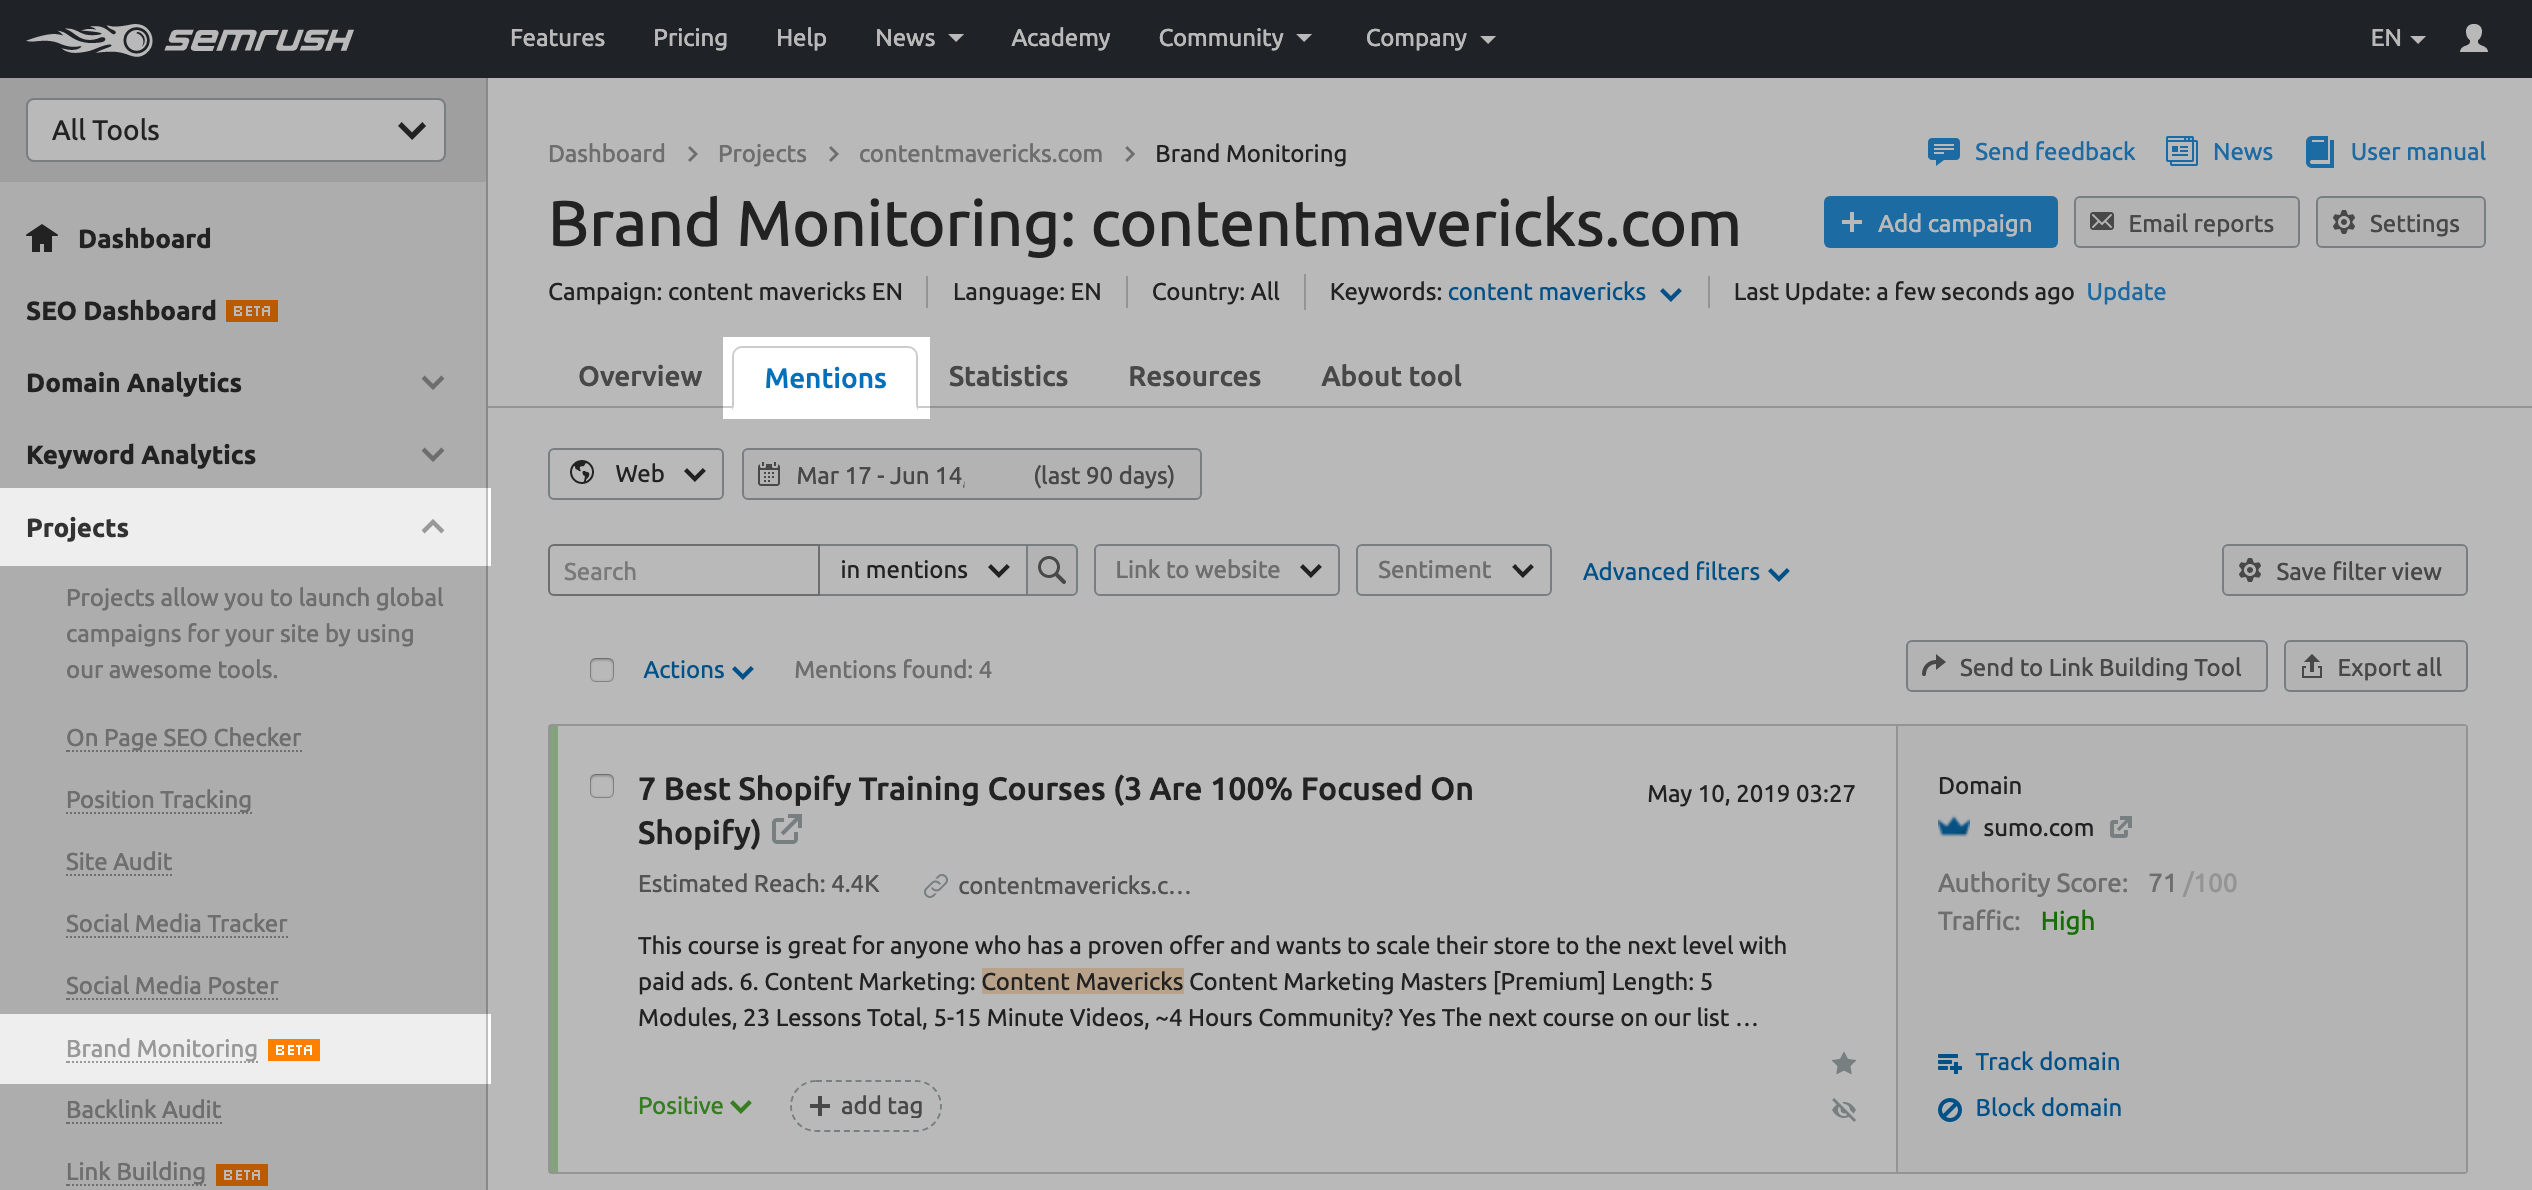
Note: Semrush is a paid tool, but they gave me a 14-day free trial for Content Mavericks readers. Perfect for tracking your brand mentions every week.
How To Optimize For Brand Mentions
- Connect with writers in your industry on LinkedIn.
- Like/comment/share their posts to get on their radar.
- Reach out to let them know you’re happy to provide unique data based on your past experience if they’re ever writing anything related to your broad topic of expertise.
14. Comments
Increase Brand Awareness
What Are Comments?
Comments are the number of people who leave a written remark expressing their opinion or reaction to your content.
Why Are Comments Important?
Visitors don’t comment on your content unless they’re genuinely engaged with it.
Tracking comments per post is a great indicator of how engaging one topic is for your audience vs another so you can double down on related topics.
Where To Track Comments
In WordPress go to Posts > All Posts.
Look at the Comments column.
If you don’t use WordPress, go to the relevant section in your content management system.

How To Optimize For Comments
- Write an email to promote your piece of content.
- In the P.S. at the end of the email give people an incentive to comment (e.g. Ps. leave a comment and I’ll send one person a free packet of beef jerky)
- At the end of your blog post ask a specific question to spark discussion.
Focus On ONE Metric
The most successful content marketers do two things:
- Set a goal for their content marketing (e.g. 100,000 organic traffic, 10k/month email list, etc)
- Track progress towards that goal within a specific timeframe.
Personally I lovvvve to grow my email list.
Because it can double as my #1 content promotion tool AND my #1 sales tool.
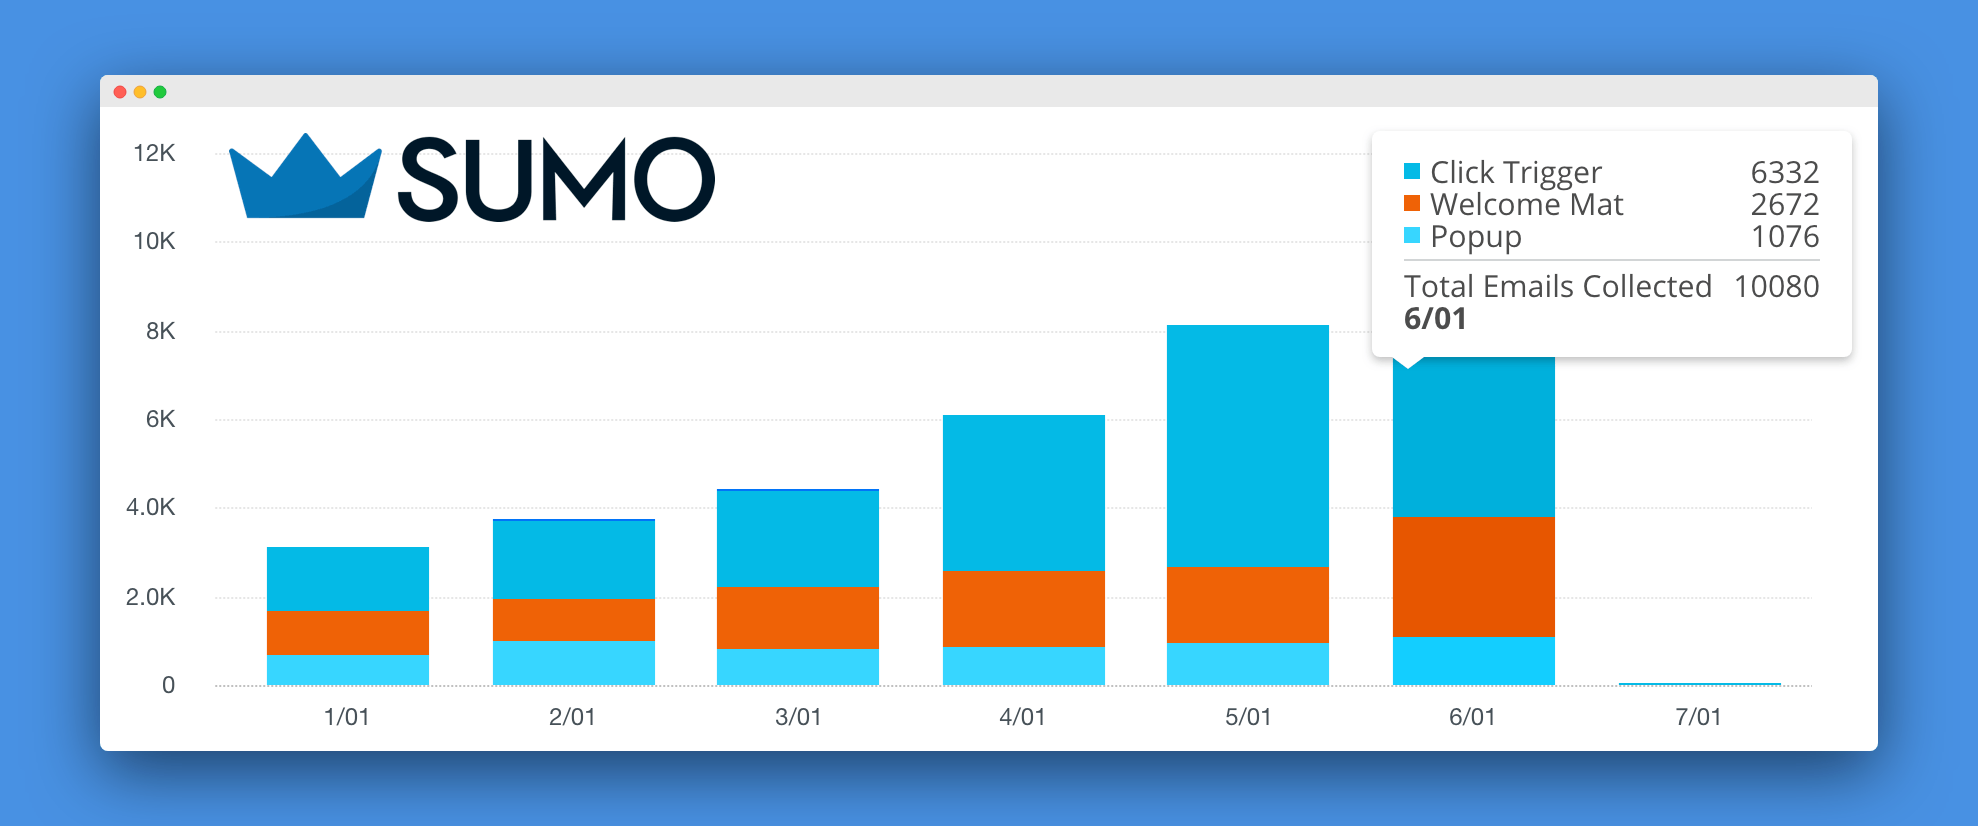
With laser focus, I grew the Sumo.com list to 10,000 emails per month.
In five months:
If you’d like to see how I:
- Setup a Google Analytics 4 event to track email sign ups.
- Identify my top email-generating blog posts.
Grab a free copy of my step-by-step content performance tracking guide below:


