Need the most up-to-date marketing stats for a blog post, or to impress someone on a first date?
We’ve curated, vetted, and categorized a list of up-to-date stats below.
Click to jump to a category, or keep reading for our top marketing statistics.
Top marketing statistics
These are the most interesting marketing stats we think you should know.
- 91% of marketers actively invest in content marketing.
- 99.22% of people never scroll past the 1st page of Google search results.
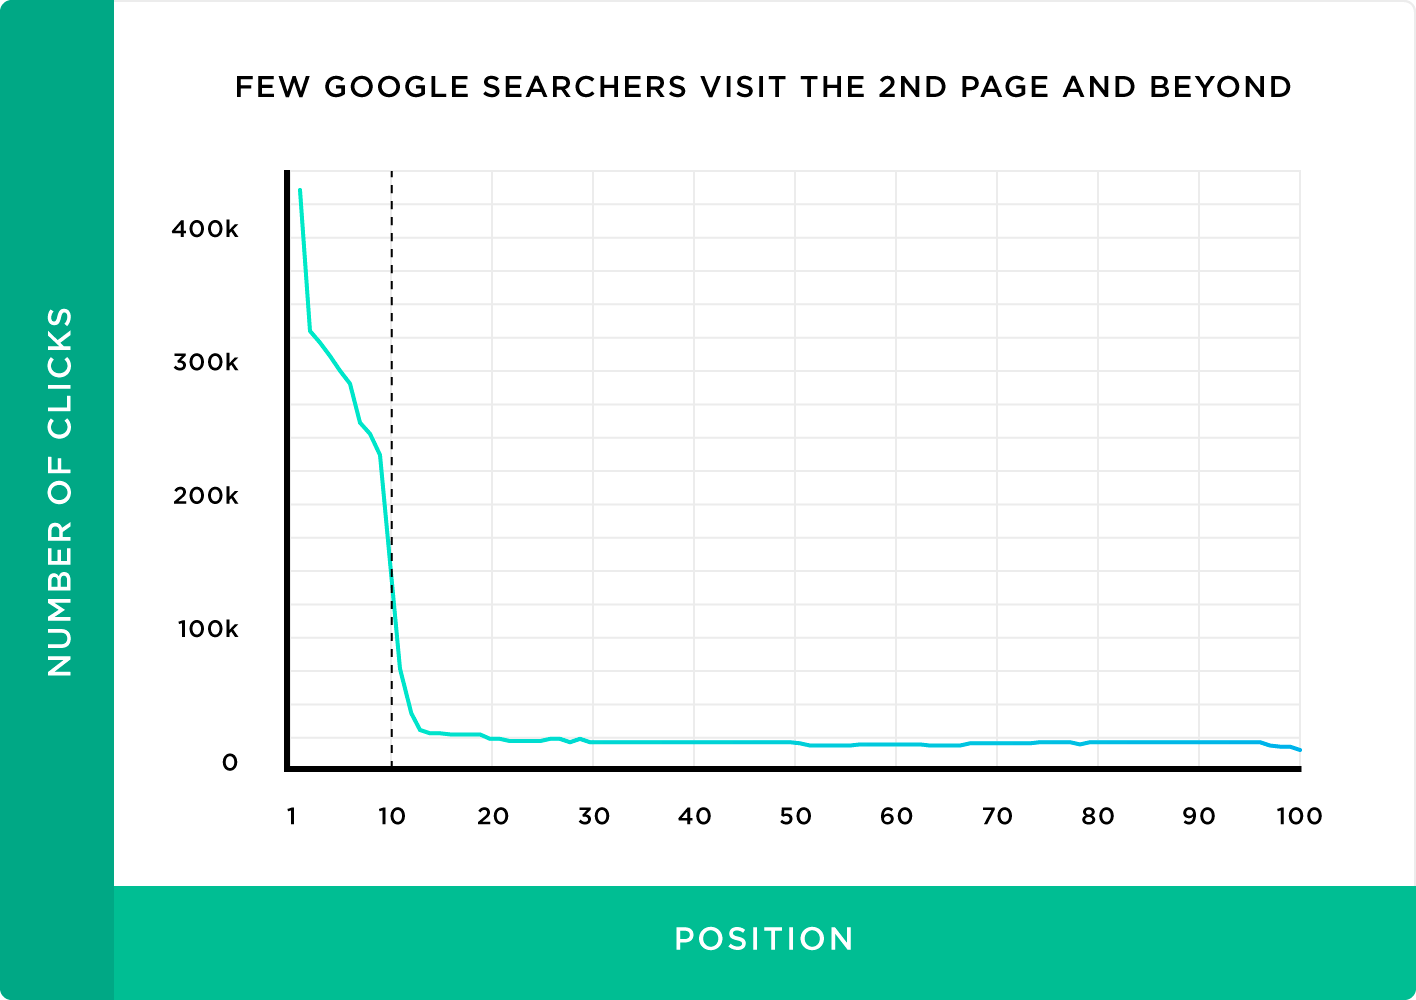
3. Companies with blogs get 67% more leads every month than companies who don’t.
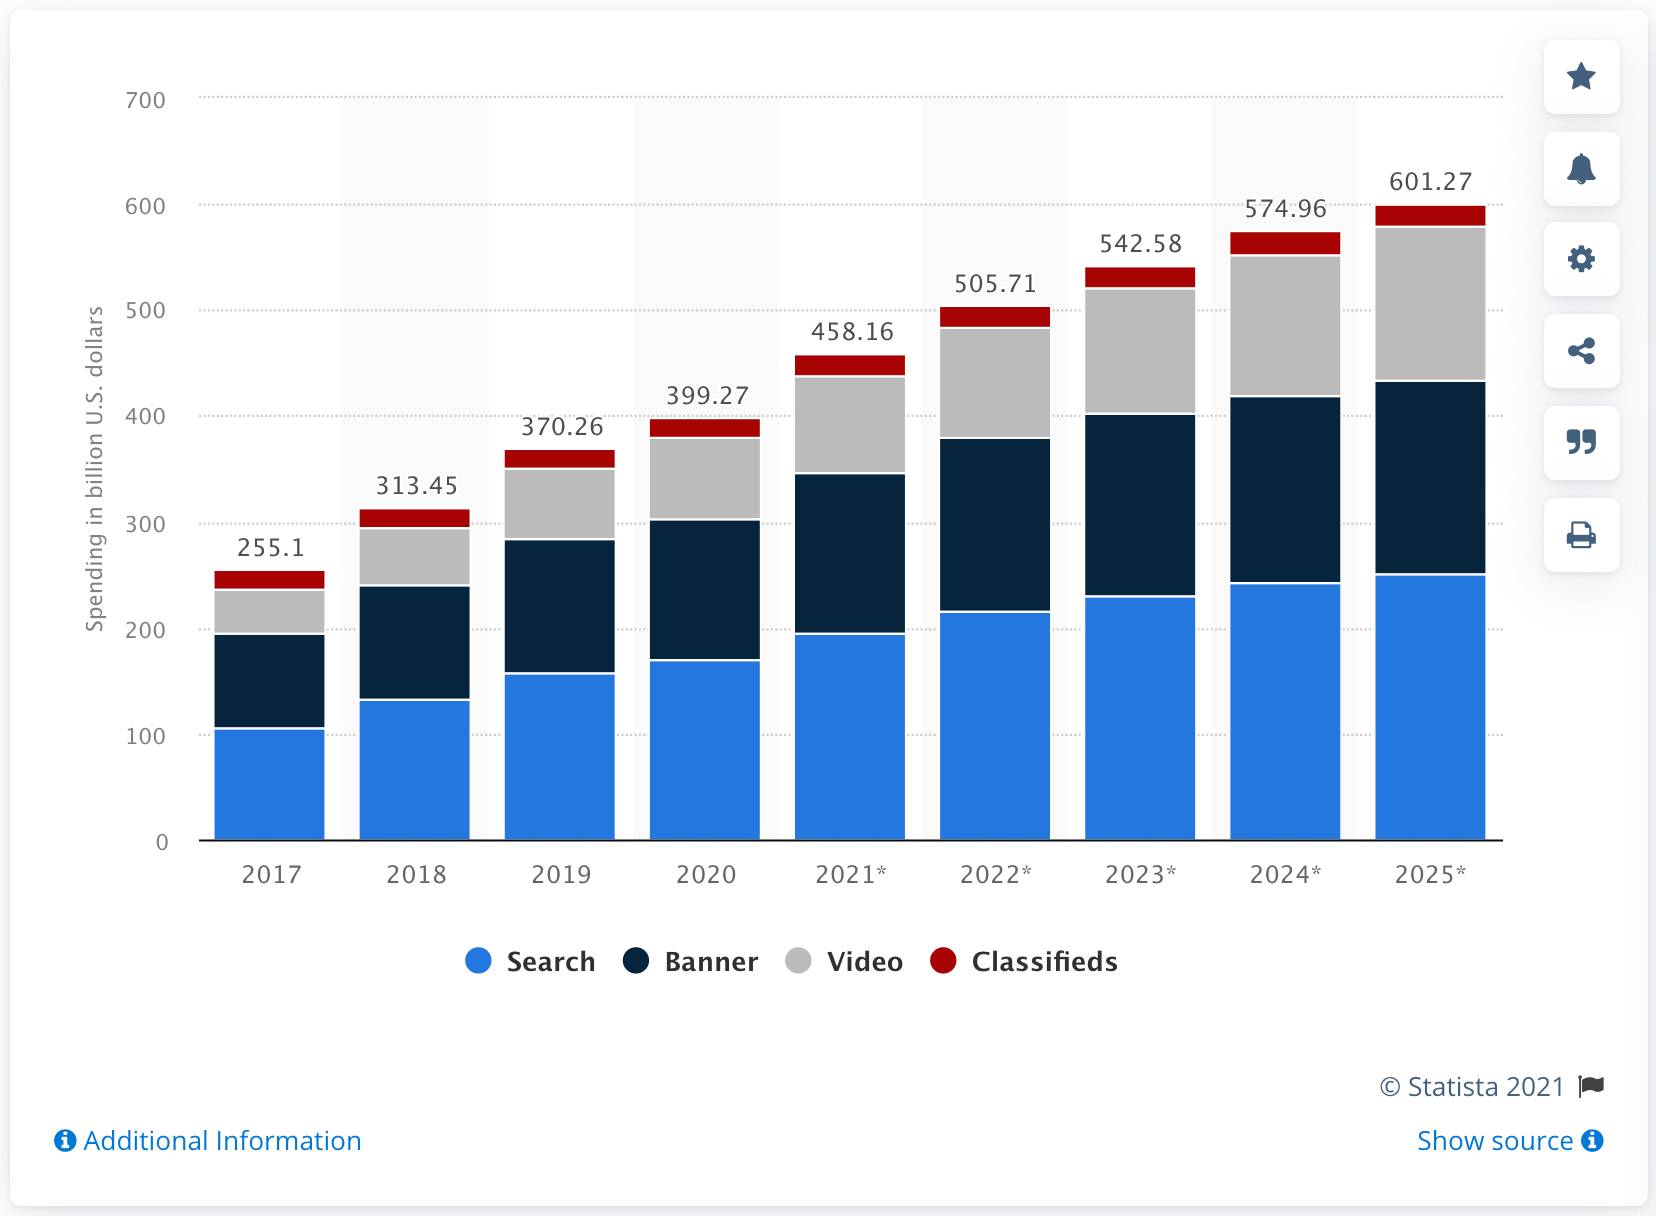
4. Global digital ad spend will hit a record high of $600 billion in 2025.
5. 72% of the American public uses at least one social media site.
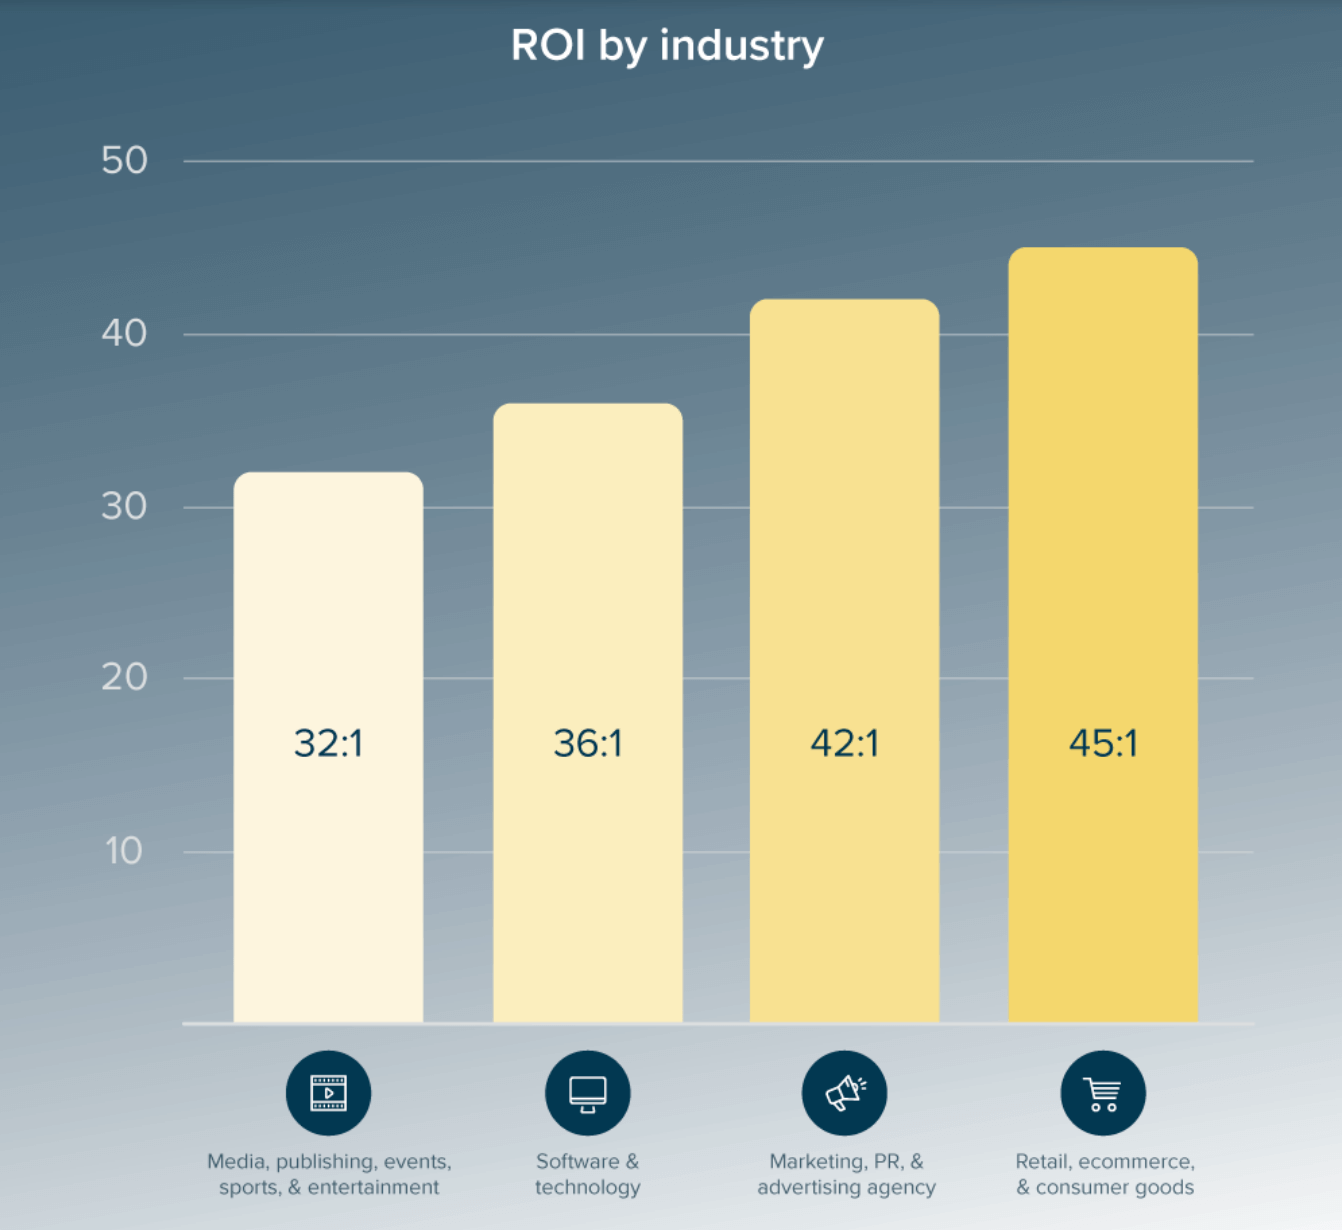
6. Email generates up to $45 for every $1 spent.
7. 69% of customers would rather learn about a product or service by watching a short video.
8. 80% of sales require 5 follow-ups to close the deal.
9. There are 7.9 million ecommerce sites across the entire globe.
Content marketing statistics
The last content marketing campaign we ran to sell chocolates never went viral, because people wouldn’t share. Not all campaigns flop that bad. Check out these content marketing stats.
- 91% of marketers actively invest in content marketing.
- 92% of companies produce blog content compared to other formats.
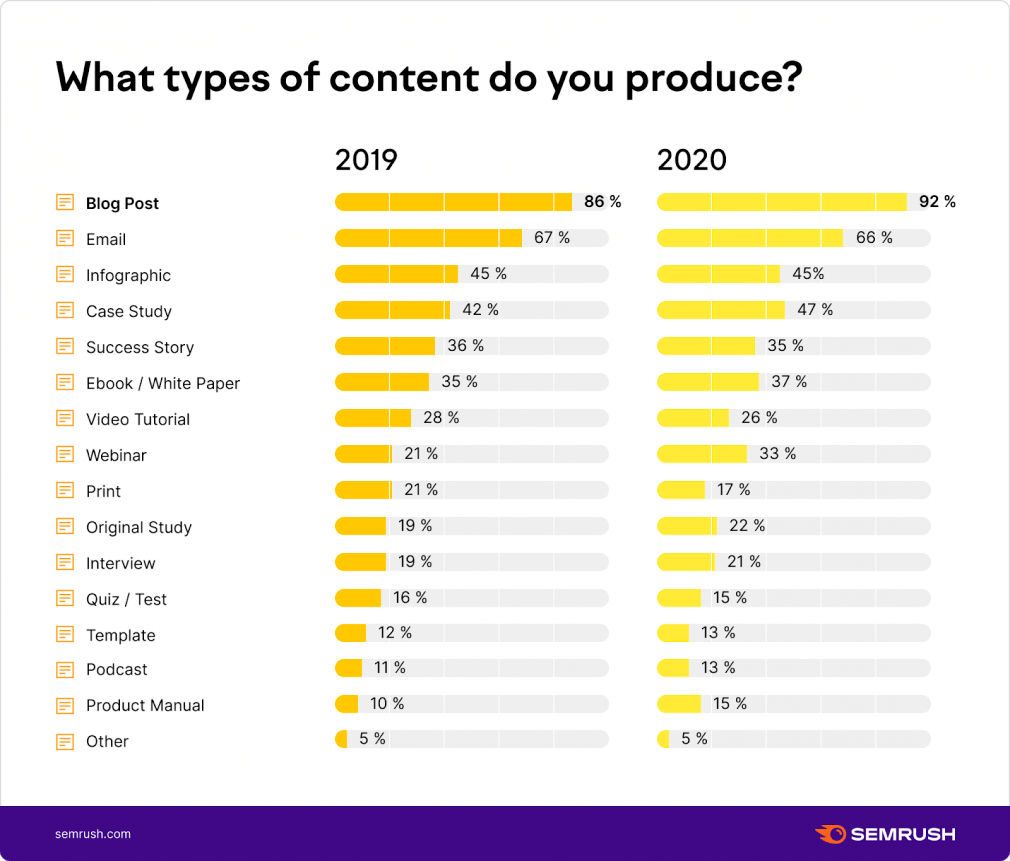
3. 52% of marketers say content marketing increases leads.
4. Conversion rates are nearly 6x higher for content marketing adopters than non-adopters (2.9% vs 0.5%).
5. 92% of marketers reported that their company views content as a business asset.
6. 70% of people would rather get information about a company or learn something from an article or blog post rather than from a traditional advertisement.
7. Year-over-year growth in company revenue is 9.6x higher for content marketing leaders compared to followers (15.4% vs 1.6%).
8. Content marketing generates over three times as many leads as outbound marketing and costs 62% less.
9. 89% of companies use organic search as their primary content distribution channel.
10. 72% of marketers say “how-to” guide content works best in terms of attracting traffic.
SEO statistics
The best place to hide a dead body is the second page of Google. These SEO stats confirm it, plus more.
- 99.22% of people never scroll past the 1st page of Google search results.
- 68% of online experiences begin with a search engine.
- 90.63% of pages get no organic search traffic from Google.
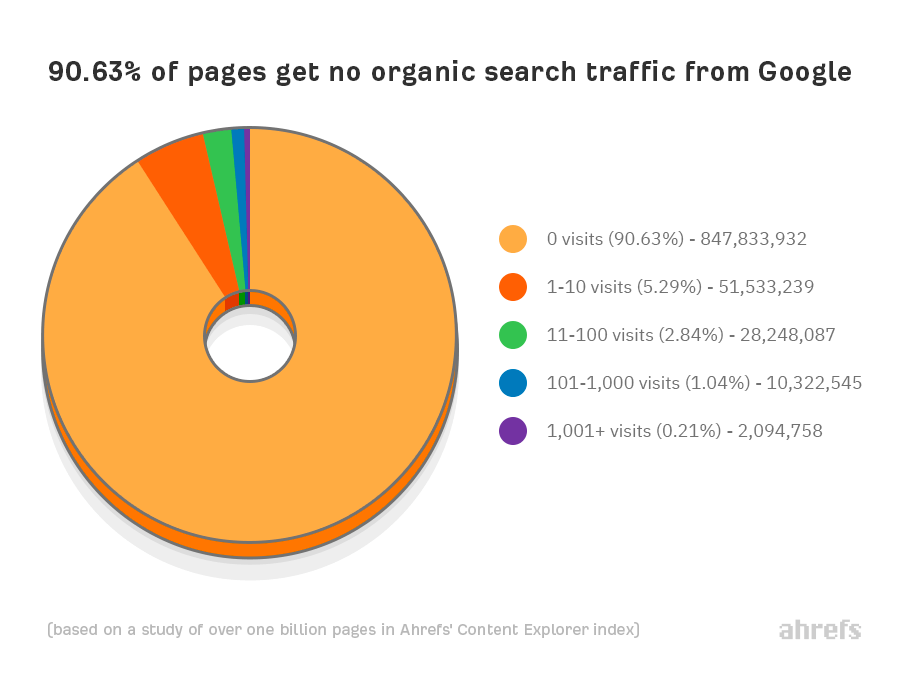
4. 64% of marketers actively invest time in SEO.
5. 70% of marketers see SEO as more effective than PPC.
6. 53.3% of all website traffic comes from organic search.
7. 60% of marketers say that inbound (SEO, blog content, etc) is their highest quality source of leads.
8. SEO drives 1000%+ more traffic than organic social media.
9. Most top-ranking pages get ‘followed’ backlinks from new websites at a pace of +5%-14.5% per month.
10. B2B companies generate 2x more revenue from organic search than any other channel.
Blogging statistics
It takes 100 bloggers to change a lightbulb. 1 to change the lightbulb and 99 to comment on how it should have been done differently. But in the end, these blogging stats prove it’s worth it.
- Companies with blogs get 67% more leads every month than companies who don’t.
- Companies that blog are shown to have 434% more indexed pages in search engines.
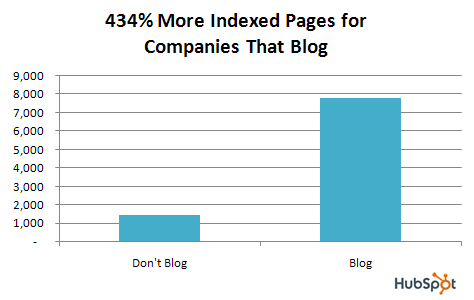
3. Companies who blog get 97% more links to their websites.
4. 60% of internet users read blogs at least once per week.
5. Blog posts with images receive 94% more views than blog posts without images.
6. 59% of people will share a blog post without reading it first, or ever.
7. Over 409 million people view more than 20 billion pages each month.
8. There are more than 600 million blogs on the internet today.
9. There are 32 million bloggers in the USA.
10. Blog post titles with 6-13 words attract the highest and most consistent amount of traffic.
3. People spend an average of two hours and 25 minutes on social media every day, equating to roughly one full waking day of their life each week.
4. 73% of marketers believe that their efforts through social media marketing have been “somewhat effective” or “very effective” for their business.
5. 54% of social browsers use social media to research products.
6. 71% of consumers who have had a positive experience with a brand on social media are likely to recommend the brand to their friends and family.
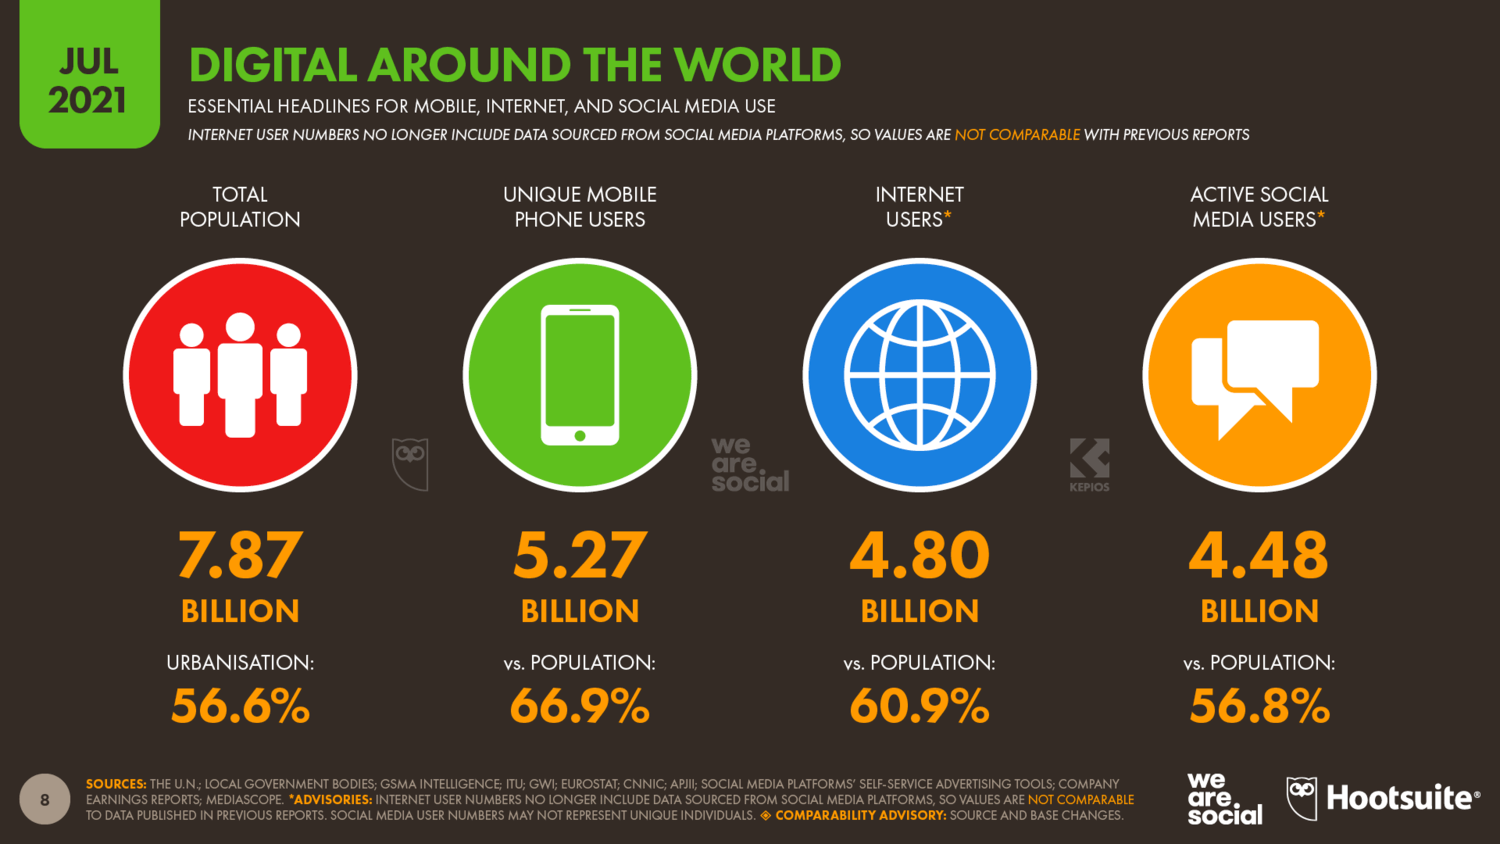
7. 56.8% of the world’s population uses social media.
8. 99% of all social media users access social networks via their mobile devices.
9. 70% of people who use Facebook check it daily.
10. TikTok has 732 million monthly active users.
Paid advertising statistics
Most paid ad managers can’t drive to work, because they generate so much traffic. Here are the top paid advertising stats to prove it.
- Global digital ad spend will hit a record high of $600 billion in 2025.
2. Google and Facebook hold the largest share of total U.S. digital ad spending, with 28.9% and 25.2% respectively.
3. The average person gets bombarded with over 1,700 banner ads per month, but only sees half of them.
4. 27% of internet users say they find new products and brands through paid social ads
5. 54% of total ad spend in the US is spent on digital advertising.
6. 26.7% of Facebook Pages use paid media.
7. The average organic reach for a Facebook post is 5.17% of a Page’s likes, while the average paid reach is 28.1% of total reach.
8. Average global social CTRs are down 30%, year over year.
9. 52% of all online brand discovery still happens in public social feeds (including paid and organic posts).
10. Teens and millennials watch 40% less traditional TV than they did five years ago.
Email marketing statistics
Email is dead, or is it? Check out these email marketing stats so you know once and for all.
- Email generates up to $45 for every $1 spent.
2. 68% of people prefer communications from businesses to come via email vs social media because email feels more personal.
3. 99% of people check their email at least once a day.
4. Marketers who use segmented campaigns notice as much as a 760% increase in revenue.
5. 53% of all emails are opened on a mobile device.
6. There are 4 billion daily email users.
7. 81% of B2B marketers say email newsletters are their most used form of content marketing.
8. Global daily emails sent will hit a record high of $376 billion in 2025.
9. 81% of small businesses rely on email as their primary customer acquisition channel.
10. 61% of people say they want to receive promotional emails from their favorite brands on a weekly basis.
Video marketing statistics
98% of videos with my cat “Pebbles” go viral. Unfortunately “Pebbles” isn’t for hire, so check out these other video marketing stats.
- 69% of customers would rather learn about a product or service by watching a short video.
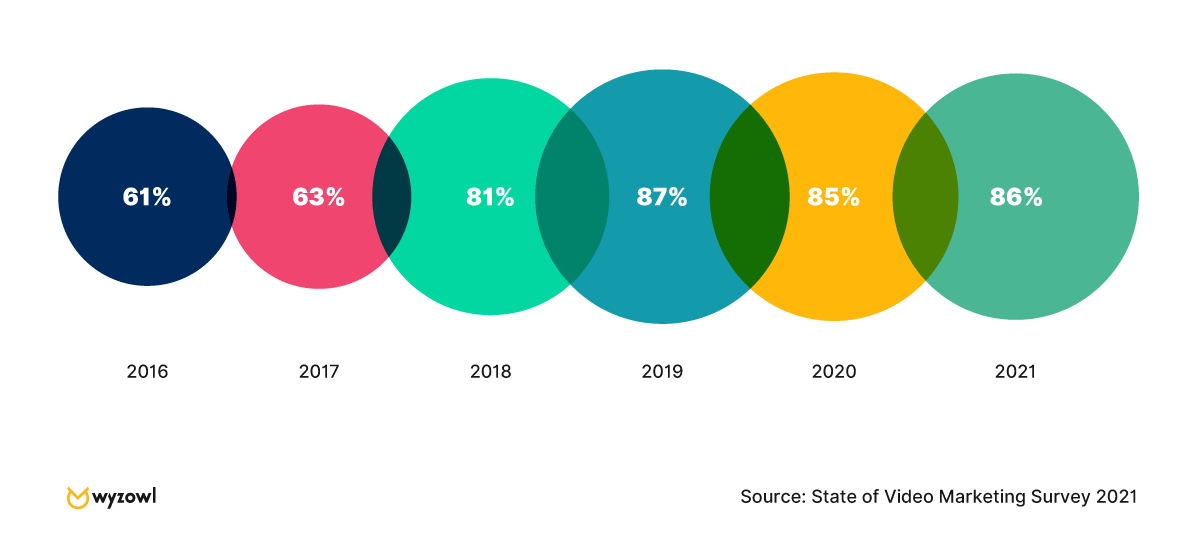
- 86% of businesses use video as a marketing tool.
3. 93% of marketers who use video say that it’s an important part of their marketing strategy.
4. Social video generates 1,200% more shares than text and images combined.
5. Marketers who use video grow revenue 49% faster than non-video users.
6. 53% of people want to see more video content from a brand or business they support.
7. 87% of marketers report a positive ROI from video.
8. 83% of all internet users in the United States watch online video content monthly on any of their devices.
9. 59% of executives agree that if both text and video are available on the same topic, they are more likely to choose video.
10. 84% of people say that they’ve been convinced to buy a product or service by watching a brand’s video.
Sales statistics
100% of glue salesmen stick to their word. Here are sales stats on all the other salesmen, plus more.
- 80% of sales require 5 follow-ups to close the deal.
- 92% of all customer interactions happen over the phone.
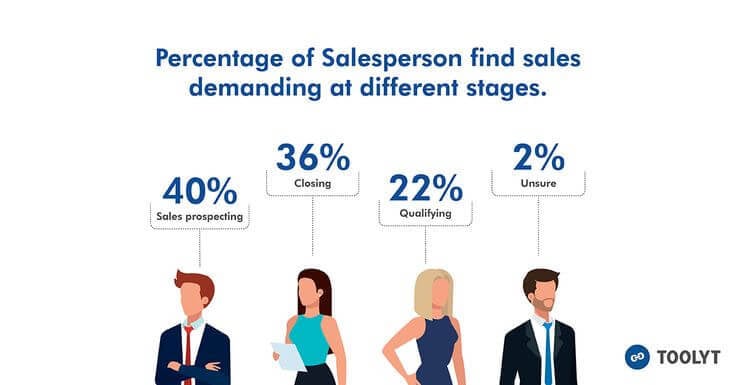
- 40% of salespeople say prospecting is the most challenging part of the sales process.
4. 35-50% of sales go to the vendor that responds first.
5. There is a 25% chance to hear back, if you send more emails.
6. Only 13% of customers believe a sales person can understand their needs.
7. Companies that lead nurture generate 50% more sales-ready leads at a 33% lower cost.
8. Sales reps only spend 34% of their time actually selling.
9. 79% of business buyers say it’s absolutely critical or very important to interact with a salesperson who is a trusted advisor — not just a sales rep — who adds value to their business.
10. 44% of salespeople give up after one follow-up call.
Ecommerce statistics
What’s the best way to sell cat food online? Develop buyer purrr-sonas. After you do that, check out these ecommerce stats.
- There are 7.9 million ecommerce sites across the entire globe.
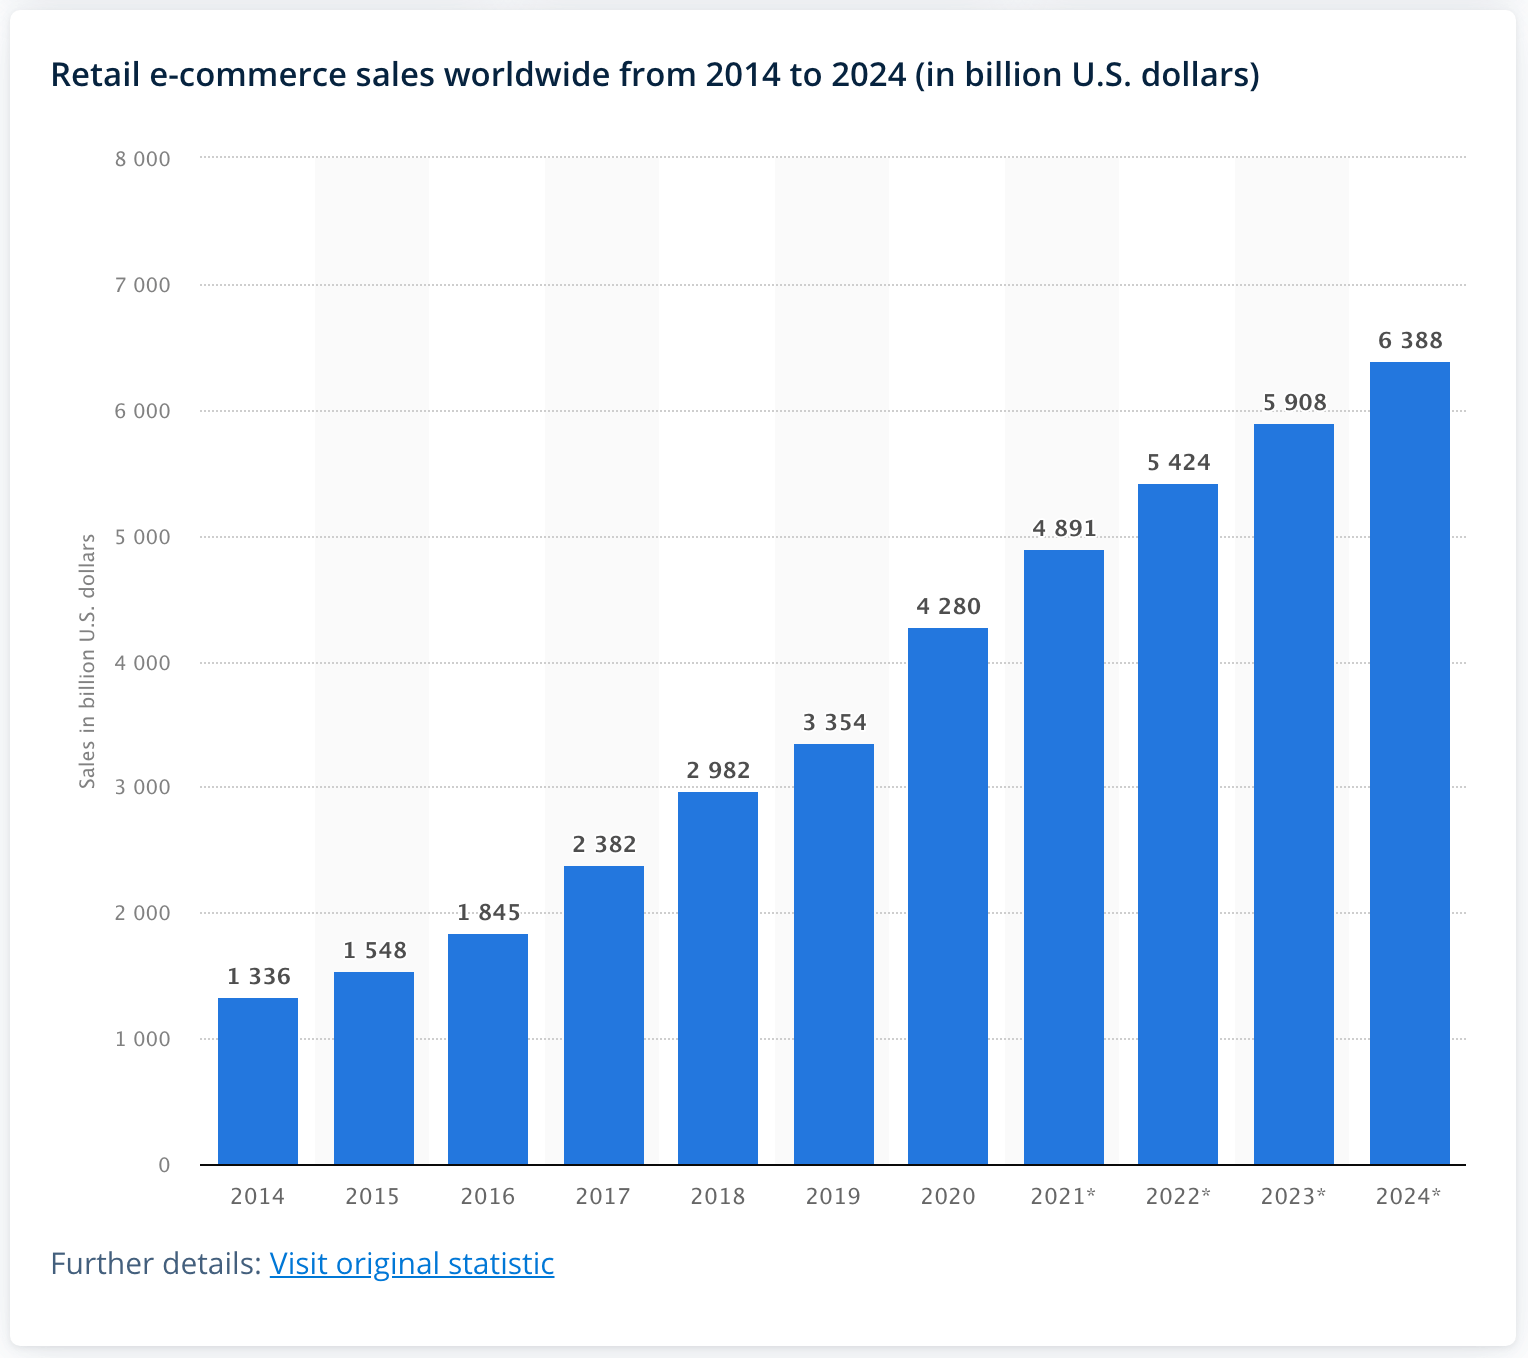
- 6.3 trillion U.S. dollars in ecommerce sales will be sold worldwide in 2024.
3. Over 2 billion people purchase goods or services online every year.
4. 22 billion people visit ecommerce websites every month.
5. 81 percent of consumers do online research before making a purchase online.
6. 57% of customers will abandon your site if they have to wait 3 seconds or longer for a page to load.
7. Nearly half (48 percent) of online shoppers simply head straight to a large ecommerce marketplace.
8. Ecommerce sales are expected to account for 21.8 percent of retail sales worldwide in 2024.
9. By the year 2040, it’s estimated that 95% of all purchases will be through ecommerce.
10. China with $2.8 trillion online sales is the first country in history to transact more than half of its retail sales online, with 52.1% of retail happening through ecommerce.
Related Articles
Top Marketing Statistics
- Content Marketing Institute (B2B Research Report)
- Backlinko (Google CTR Stats Study)
- Demand Metric (Content Marketing Infographic)
- Statista (Digital Advertising Spending Worldwide)
- Pew Research (Social Media Fact Sheet)
- Litmus (Email Marketing ROI Infographic)
- Wyzowl (The State of Video Marketing Report)
- Invesp (Sales Followup Statistics)
- etailinsights (Ecommerce Industry Breakdown)
Content Marketing Statistics
- Content Marketing Institute (B2B Research Report)
- SEMrush (Content Marketing Statistics)
- Content Marketing Institute (B2C Research Report)
- Aberdeen (Content Marketing ROI Study)
- Content Marketing Institute (Strategy Survey)
- Demand Metric (Content Marketing Infographic)
- SEMrush (Content Marketing Funnel Study)
SEO Statistics
Blogging Statistics
- Demand Metric (Content Marketing Infographic)
- HubSpot (Business Blogging Study)
- HubSpot (Blog Reading Study)
- PR Daily (Visual Content Study)
- Columbia University (Social Media New Consumption Study)
- WordPress (WordPress Stats)
- Hosting Tribunal (How Many Blogs Study)
- FirstSiteGuide (Blogging Statistics)
- HubSpot (Compounding Blog Posts Study)
Social Media Statistics
- Pew Research (Social Media Fact Sheet)
- DataReportal (Digital Global Statshot)
- DataReportal (Digital Global Overview Report)
- Buffer (State of Social Report)
- GlobalWebIndex (Social Browsers Chart)
- Lyfe Marketing (Social Media Marketing Statistics)
- DataReportal (Global Social Media Stats)
Paid Advertising Statistics
- Statista (Digital Advertising Spending Worldwide)
- eMarketer (US Digital Ad Spending)
- SmallBizGenius (Advertising Statistics)
- Hootsuite (Digital Global Statshot)
- Statista (US Digital Advertising Industry)
- Hootsuite (Digital Report)
- Statista (Social Media Advertising CTR Worldwide)
- MarketingCharts (State of Traditional TV Report)
Email Marketing Statistics
- Litmus (Email Marketing ROI Infographic)
- Bluecore (Millennials Brand Engagement Report)
- OptinMonster (Email Marketing Statistics)
- Campaign Monitor (Email Marketing Study)
- Statista (Email Users Worldwide)
- Content Marketing Institute (B2B Research Report)
- Statista (Emails Sent Per Day Worldwide)
- Emarsys (Omnichannel Commerce Whitepaper)
- MarketingSherpa (Email Research Chart)
Video Marketing Statistics
- Wyzowl (The State of Video Marketing Report)
- Wordstream (Video Marketing Statistics)
- HubSpot (Digital Consumer Trends Report)
- Statista (US Online Video Usage)
Sales Statistics
- Invesp (Sales Followup Infographic)
- Brevet (Sales Statistics)
- HubSpot (Sales Statistics)
- Marketo (Lead Nurturing Guide)
- Salesforce (Sales Statistics)
Ecommerce Statistics
- etailinsights (Ecommerce Industry Breakdown)
- Statista (Retail Ecommerce Sales Worldwide)
- Statista (Ecommerce Worldwide Statistics)
- Chain Store Age (Purchase Shopper Study)
- Kinsta (Ecommerce Statistics)
- Oberlo (Ecommerce Statistics)
- Statista (Ecommerce Share of Total Global Retail Sales)
- Nasdaq (UK Online Shopping Statistics)
- Shopify (Global Ecommerce Statistics)


Social media statistics
I nicknamed our office dog “The Vast Majority Of Social Media” because he doesn’t like me, follow me, or share anything. Here are some other social media stats that are a bit more inspiring.